Visualising the New Zealand Index of Multiple Deprivation
Dr. Daniel John Exeter, Dr. Jinfeng Zhao, Dr. Sue Crengle, Dr. Arier Chi Lun Lee and Michael Browne, Epidemiology and Biostatistics, FMHS
The Research
The New Zealand Index of Multiple Deprivation (IMD) allows one to look at disadvantage in overall terms, as well as in terms of seven domains of deprivation: Employment, Income, Crime, Housing, Health, Education and Access. The seven domains are weighted to reflect the relative importance of each domain in representing the key determinants of socio-economic deprivation, the adequacy of their indicators and the robustness of the data that they use. The IMD uses routinely collected data from government departments, census data and methods comparable to current international deprivation indices to measure different forms of disadvantage.
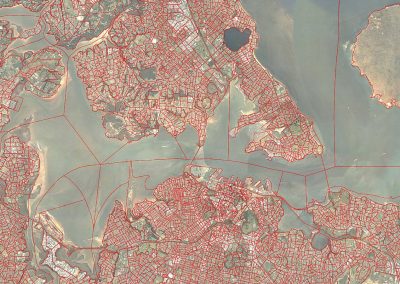
 The IMD measures deprivation at the neighborhood level using custom data zones that were specifically developed for social and health research. The New Zealand (NZ) land mass has 5,958 neighbourhood-level data zones that have a mean population of 712 people. In urban settings, data zones can be just a few streets long and wide. Data zones are ranked from the least to most deprived (1 to 5958) and grouped into five quintiles for mapping purposes.
The Index of Multiple Deprivation was developed by the IMD Team based at Epidemiology & Biostatistics at the School of Population Health: Dr. Daniel John Exeter, Dr. Jinfeng Zhao, Dr. Sue Crengle, Dr. Arier Chi Lun Lee and Michael Browne, with help and support from numerous individuals and organizations.
The Vision
The research into the impacts of deprivation and health inequalities aims to improve understanding of service quality and the degree of disparities across population groups, to inform agencies and policy makers, and to prompt system change, greater responsiveness and equity of health service provision. The vision is for the IMD and the data zones to be widely used for community advocacy, research, policy and resource allocation, providing a better measurement of area deprivation in New Zealand, improved outcomes for Māori, equity of service provision, and a more consistent approach to reporting and monitoring the social climate of New Zealand.
Creating a visual interface for dynamic research analysis
As part of the research project, the IMD team developed a series of online interactive atlases using some proprietary software. The existing atlases are very flexible and informative, but do not provide the ability to create a dynamic report for users to download. The principal investigator, Dr. Daniel Exeter therefore sought advice from the visualization experts at the Centre for eResearch to provide an open-source mapping solution, which provided such functionality.
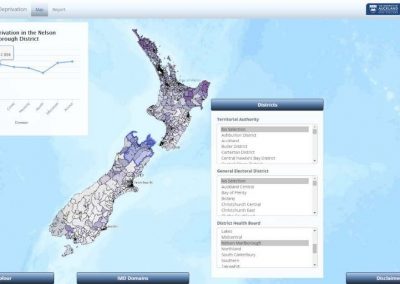
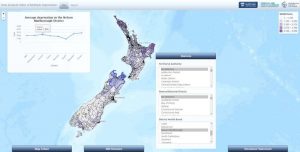
An interactive map interface which can be used to explore the geography of deprivation and its association with a given health or social outcome over the seven domains was developed. It illustrates the IMD by ranking the data zones from the least to most deprived (1 to 5958) and grouping it into five color coded quintiles. Quintile 1 (Q1 – light shading) represents the least deprived 20% of data zones in the whole of NZ; while Q5 (dark shading) represents the most deprived 20%. When a user zooms into a place of interest and selects some data zones of interest the line graph updates to highlight the rank of overall deprivation (the IMD) and its 7 domains. This is useful in highlighting that the drivers of deprivation can differ markedly between neighborhoods, even if they have similar IMD ranks overall.
In addition to the interactive map, staff at the Centre for eResearch created an application that provides the means to download dynamically created reports for a particular administrative area of interest. At this stage, users can select from District Health Boards, Territorial Authorities, or General Electoral Districts to zoom into. Every report includes several maps and summary statistics calculated on the fly depending on the user’s choice of district.
This combination allows for a great overview while also providing the means to gather selective and detailed information depending on the viewer’s area of interest.
Who is the intended user community?
This project was prompted in part by a request from a DHB Funding and Planning agency to have reports available within their DHB rather than for the entire population. This atlas will be added to the existing suite of visualization tools the IMD team has developed, to provide outreach for the general public, as well as researchers, policy analysts and organizations who are interested in better understanding the socio- economic circumstances of the communities they serve. The real strength in this application is the ability to quickly generate a report of deprivation in the area of interest.